2013 February Column
Philip James

Editor's note
Philip James has written a series of ten contributions identified as 'As I see it', published monthly on the Association's home page since March 2012. These
contributions now continue here as a regular column.
London. Last month I expressed doubts about the validity of the gigantic Global Burden of Disease study whose initial results were published in December in The Lancet (1,2). Its startling findings on for example the apparent high risk of death when not enough fruits or nuts are consumed, may be an artifact of the methodologies chosen by the statisticians who are the lead authors of the study. I am especially concerned about reliance on manipulating disparate surveys that rely on people remembering and reporting what they consume, and which may not always adequately adjust for key confounding factors. If potential risk factors are then related to estimates of later multiple disease states, it can easily induce misplaced confidence in the validity of the conclusions about which risk factors were responsible for what disease burden. This is particularly true of less resourced countries with rudimentary data (in which much of the world's population lives).
With apologies to readers looking forward to some light-hearted observations and jovial anecdotes, this month I find myself pondering the results of another vast study, this time on body weight and health.
First, I heard from colleagues at the Johns Hopkins Global Center on Childhood Obesity that there was a new paper from the US government agency the Centers for Disease Control and Prevention, published in the Journal of the American Medical Association, saying that marked degrees of overweight do not matter and might even be beneficial. This is an old saga which I feared would immediately attract publicity. So it proved (3). In the first days of the new year the study was heralded in Time magazine, and in the Wall Street Journal and other leading US media; and also in The New York Times op-ed pages as 'Our absurd fear of fat' (4). The writer, Paul Campos, a professor of law (below, left), who is a well known denigrator of much of my professional work, and author of The Obesity Myth: Why America's Obsession with Weight Is Hazardous to Your Health,claimed that the study 'found that all adults categorized as overweight and most of those categorized as obese have a lower mortality risk than so-called normal-weight individuals. If the government were to redefine normal weight as one that doesn't increase the risk of death, then about 130 million of the 165 million American adults currently categorized as overweight and obese would be re-categorized as normal weight instead'.
Overweight and obesity
Fat matters

Obesity, disease, death, once again in the US news. Left to right are the lawyer Paul Campos; and federal officials William Dietz, Katherine Flegal
Be fat and live longer... This would indeed be a novel way to solve the obesity problem in the US and worldwide. So I reckoned I had better investigate. The findings seemed particularly disturbing given that the CDC now is led by David Freedman, who has helped Mayor Michael Bloomberg to give public health a top priority in New York City.
The nutrition, physical activity and obesity group at CDC has also thrived for more than a decade under the leadership of William Dietz (above, centre) who has done so much under extremely difficult political conditions to establish, through state-led and community initiatives, imaginative approaches to dealing with the atrocious food culture in the automobile-obsessed physical environment of the US. His job was never easy. I found this out when I persuaded the UK Parliamentary Health Select Committee during their October 2003 visit to the US that they should go to see Bill Dietz's team at CDC.
We arrived to be confronted by a political appointee who conducted the meeting, and who extolled President George W Bush's personal initiatives on obesity, which seemed to amount (see George W below, left, wearing #1) to 'get jogging and don't worry about the food industry'. She steered every enquiry away from CDC's pioneering work on public health, towards the expensive individualistic medical approaches to health which so obsess the US political class. This was and is nothing new with the US food industry well known for its intense and well-funded lobbying of Congress, and focus on diverting attention towards physical activity as the principal answer to the obesity problem.

Keep on running and you won't get fat, was the view in the George W Bush presidency. The US food industry still insists that exercise is the answer
Can it be best to be fat?
The first and lead author of the new paper (3) is Katherine Flegal (top row pictures above, right), senior scientist at the CDC National Center for Health Statistics, an empire of its own within the huge range of the CDC's divisions. She has been publishing on obesity for the last 25 years. This new paper is not just of US data, understandably her previous focus, but is a systematic review and analysis of the world's literature. It is making global judgements.
Katherine Flegal and her colleagues decided that there were 97 studies which warranted detailed scrutiny, involving 2.88 million adults, 270,000 of whom had died during the studies. Big numbers. Of the 97 studies accepted, pooled and analysed, 85 came from North America, Europe and Australia,9 from Asia (China, Taiwan, India, Japan, Israel), and 3 from Latin America (Mexico and Brazil). None from Africa.
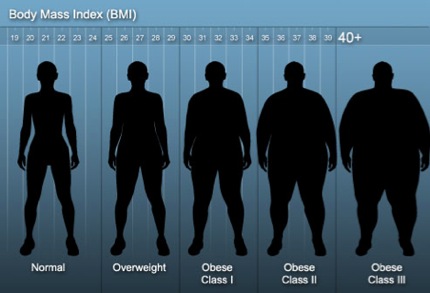
The conclusion of the new paper are remarkably similar to what Katherine Flegal has always claimed for the US population, which is that being overweight in adult life, with a body mass index (BMI) between 25 and 30, is optimum, because as she and her colleagues compute the data, this group has the lowest death rate.
The new paper emphases that most of the individual studies analysed are consistent with overweight being the optimum weight. Compared with people with BMIs between 18.5 and 25.0, which is the World Health Organization range for 'normal' or 'acceptable' body mass (5), 'overweight' people with BMIs from 25 up to 30 had death rates expressed as 'hazard ratios' of 0.94, which is to say a 6 per cent lower mortality. This was statistically significant. Actually even being 'grade 1 obese' with BMIs of 30 up to 35,had a 'hazard ratio' of 0.95, but this 5 per cent lower rate, while taken to be suggestive – and ramped up by Paul Campos – was not quite statistically significant in showing a benefit of even being obese.
Amazing data from the US Centers for Disease Control: it seems to be best to be overweight or perhaps even somewhat obese, as shown in this graphic
To realise how astounding these findings are, see the graphic above. In numbers, at 32.5 BMI, midway between 30 and 35, a man of 1.80 metres or 5 foot 11, weighs 105 kilograms or 232 pounds (16 stone 8 pounds), and a woman of 1.70 metres or 5 foot 7, weighs 95 kilograms or 207 pounds (14 stone 11 pounds).
It was only when people were 'grade 2 obese', at BMIs of 35 up to 40, which is edging up to gross obesity(again, see the graphic) that the ratio went above 1.0, and at 1.29 was 29 per cent more risky. Furthermore this hazard mostly applied to people under 65 years of age; over that age the risk was measured at only 10 per cent higher.
This new study may well have the effect of stalling some public health initiatives at least in the US. I regard its analysis as misleading. It is likely to cause endless confusion, as journalists always tend to jump on something seemingly novel and contrary to received wisdom. Writing as a worker in the field of obesity for the last four decades I am wondering how many more unhelpful analyses like this are going to muddle the minds of the public – and also of policy-makers and decision-takers.
Self-reporting of height and weight is biased
One striking feature of studies involving huge numbers of people, is that the basic information collected is typically primitive, being based on questionnaires which the subjects are asked to fill in themselves. Numerous reviews of this methodology verify common sense, which is that when people are asked about their size, the results are biased. People who are overweight or obese tend to under-report their weights and over-estimate their heights more than do normal weight people. Women, who have greater sensitivity to these issues, are even more likely to under-report their weights (6). This leads to errors, as shown vividly by a paper (7) analysing the very same US data often used by Katherine Flegal and her colleagues in the CDC Center for Health Statistics. The hazards of being obese are obscured and minimised when data comes from self-reporting. You don't need to be a statistician to realise this; or perhaps I should say, you do need to be a statistician not to realise this. The bias also occurs internationally, as shown for example in analyses of data from Pakistani men (8).
So where did the original data on appropriate weights for a long life come from? I can tell you, as one of the researchers originally involved. Forty years ago, working on a report for the UK Medical Research Council, to be jointly published by the UK government (9), I found dusty tables compiled for the US Metropolitan Life Insurance Company on a shelf in the London School of Hygiene and Tropical Hygiene library. The company had assessed literally millions of US men and women who over the decades before the Second World War had taken out life insurance policies. All these people had been measured for height and weight, in light clothes and shoes. That is to say, their BMIs were measured objectively with reliable instruments. They had then lived their lives, and then died, when their relatives claimed their insurance policies. After making allowance for clothing and the height of shoes in those days, and including the three subjectively assessed 'frame sizes', when I put all the results together I found that the men who lived longest had BMIs of 19.7 up to 24.9, and the longest-lived women had BMIs of 19.1 up to 24.6.
These figures were rounded up to 20 to 25 as a measure of 'normal' weight by John Garrow (10), until Anna Ferro-Luzzi, John Waterlow and I derived a new lower figure of 18.5 based on analyses in Latin America, Africa and Asia (11). Ever since then the World Health Organization, concerned with global issues and not just those of the global North, continues to use BMI 18.5 up to 25 as the 'acceptable' or 'normal' range, and continues to verify this range as appropriate.
Smoking confounds results
It has been well-known for a quarter of a century and more, that smoking kills, and also that smokers on average weigh less than non-smokers at all times, and not only when they become infirm or diseased, because of smoking. That is to say, adults with light weights are more likely to be smokers. This means that studies on weight, BMI, health and disease, to be reliable, must control for smoking.
The new paper from the CDC Center for Health Statistics acknowledges that smoking is an issue, and makes clear that this was allowed for – but astonishingly, only when data on non-smokers were available! It means that when the distinction between smokers and non-smokers was not made, the authors of the new paper simply stormed on and analysed all the data whether these involved smokers or not. This alone vitiates the paper.
Figure 1
The risks of smoking and of obesity
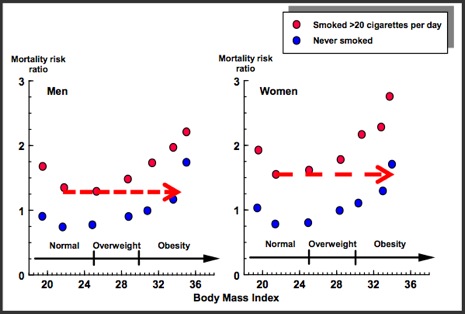
Adapted from figure (3) in reference (12). The red arrows added here show that
thin smokers have about the same risk of death as very obese non-smokers
To emphasise this point, see figure 1. I devised it when I was secretary and drafter of the London Royal College of Physicians of London's 1983 report on obesity (12). The data, from the American Cancer Society, recorded both smoking and the estimated heights and weights (unfortunately not measured) of a million US adults, followed up for many years. This analysis, albeit less precise than ideal, indicated that a smoker with a BMI of around 22 is as likely to die as is a very obese non-smoker with a BMI around 35, as shown by the dotted red lines in the figure. The obesity report stated: 'Where no distinction is made between smokers and non-smokers, the data suggest that it is beneficial to be overweight or even marginally obese'. We have been here before!
Figure 2
Optimum BMIs: non-smokers, and all people
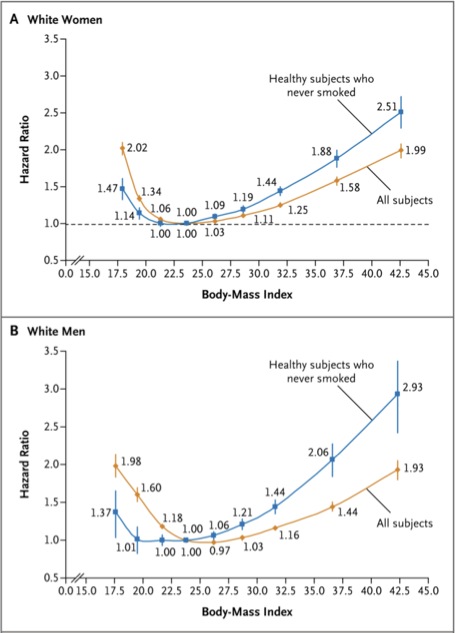
From reference (13). If the graph had been expressed as actual death rates then the brown line showing the combined data on smokers and non-smokers would have been set at a higher level than the blue line. The graphs are however a comparison of the relative risk when the death rate for both the blue and brown lines have been set at zero for those with a BMI of 22.5-24.9. Then the other groups for both the blue and brown lines are expressed as a ratio of the death rate in each case.
These early assessments of the dramatic confounding effects of smoking were reinforced in 2010. The relationship between body mass indices and mortality of nearly 1.5 million white adults were analysed with smokers separated out (13). As shown in figure 2, the BMIs for both men and women who never smoked associated with lowest risk of mortality, as shown in the blue lines, was assessed as between 22.5 and up to 24.9.
Figure 2 also shows that when all the data are put together and the effect of smoking (in adults who had neither overt heart disease nor cancer at baseline) is ignored, then the curve of risk levels, as shown in the brown lines, is less pronounced. Furthermore by ignoring the effect of smoking this brown line again wrongly implies that being overweight rather than a normal weight reduces in men one's risk of death by 3 per cent.
When a real attempt is made to control for the effect of smoking in another analysis of 900,000 adults the upper limit for the optimum BMI was confirmed as below 25 (14).In this other analysis even lower BMIs, below about 22.5, seem to then again become hazardous, but the authors admit they may not have taken full account statistically of the impact of smoking – heavy smokers, who are often thin, are far more likely to die prematurely.
Now we have new evidence of the hazards of smoking. The Lancet very recently published an analysis of a million women in Britain. This shows that those who never smoked have only a third of the death rate of smokers (15) For ex-smokers, stopping before the age of 40 years reduces risk by 90 per cent; before 30, by 97 per cent.
Given all this evidence about the impact and the confusing effects of smoking, I looked a little more closely at some of the studies that Katherine Flegal and her colleagues used. In apparently showing the insignificance of overweight, they use data from a UK study (16), which shows that smoking is a crucial confounding factor. Yet they chose to display only those data mixing smokers and non- smokers rather than the data on non-smokers alone which again showed that it is best to have a BMI less than 25. The purpose of the paper by the authors of the UK study was to highlight the misleading nature of combining data on smokers and non- smokers as well as not excluding those who die soon after the study starts! So it is very extraordinary that the CDC new analysis chose only the data explicitly cited as misleading. I think I should say no more on this point.
People with disease need to be excluded
The new CDC study also does not underline that it includes deaths that took place a short time after the start of the study. This despite the fact that for several decades now there has been general agreement that such early deaths need to be excluded, in order to avoid contamination with data from people who are losing weight because of cancer or other terminal conditions like advanced intestinal diseases not diagnosed at the time of entering a study.
This strange decision was taken because in the opinion of the CDC group such exclusion is not necessary (17).They claim that as many people who die during the early stages of studies are as likely to be overweight as underweight, that some people increase in weight shortly before death, and that people with cancer generally do not lose weight in the late stages of the disease. .
In the UK paper (16) the authors responded to the insistent claims made by the CDC paper, based on US data and the US situation, that overweight especially in older age is not important, and indeed that better handling of diabetes and cardiovascular disease and more pervasive screening for some weight-related cancers was making even obesity unimportant (17).The UK team used data from young men and women (unlikely to have chronic non-communicable diseases, including cancer) who had been followed up for an unusually long time – with one group for 29 years and the other for 32 years.. This greatly reduced the chance of recruiting people who were soon to die. With this factor accounted for, together with the effect of smoking, the study showed that both overweight and obesity are associated with higher risk of death.
Death is not the only criterion
So far this discussion has been about body mass and risk of death. But this is not the only issue. Morbidity is also an issue, especially in those parts of the world where people don't have the money to be treated for chronic diseases for say up to 15 or 20 years.
Last month my column (1) highlighted the new Global Burden of Disease study, whose authors have chosen BMIs of 21-23 as optimal, based seemingly on evidence of mortality, even though the purpose of the study has been to examine disease and disability as well as risk of death.
As mentioned, this fits with the optimal range of BMI agreed internationally by the World Health Organization. The lower figure of BMI 21 takes account of disabilities linked with decreasing as well as increasing BMIs. This said, it is now known that the risk in Caucasian women of developing diabetes is 5-6 times greater at a BMI of 24.9 than at a BMI of 20-21, and that the increased risk in men is nearly as high. In Asians the risk of diabetes at these levels of BMI is between 2 and 5 times higher still, which for many now justifies an upper limit of healthy BMI not of 25, but 23.
Public health nutritionists with experience and knowledge of real world conditions, most of all outside the most privileged and economically wealthy countries, are liable to feel initially confused and dismayed by inevitably influential paradoxical judgements coming from a US federal government agency.
With all the publicity given to this sort of analysis, together with its superficial coherence, we in the profession need to continue to reiterate the solid conclusions that have been constantly reaffirmed over the last few decades. How can such a prestigious organisation as the CDC, with all its recent important developments for public health, see these analyses as a contribution to societal well-being?
Let's put it in a broader context. There is I suggest, a great deal to be said for relying on what still remains a pretty transparent and accountable UN system, where the realities and needs of less resourced countries whose people can't afford to be treated for disease for much of their lives are fully taken into account. There is a very worrying tendency for groups, funded particularly in the US either by the government or more recently by multi-billionaires, to assume they should now determine global health as well as global warming and indeed global economic policies.
Carefully developed evidence and reliable policies and actions, produced in a global context, are being contradicted by interested parties outside the UN. These either use novel complex approaches which dazzle and bemuse onlookers but may not relate to reality, as I suggested last month (1), or else present a narrow view based on very questionable evidence, poor reasoning, and apparent ignorance of what goes on in the wider world.
References
- James WPT. Global burden of disease. Hands on world health, disease, death [Column]. Website of the World Public Health Nutrition Association, January 2013. Obtainable at www.wphna.org.
- Lim S, Vos T, Flaxman A, et al. A comparative risk assessment of burden of disease and injury attributable to 67 risk factors and risk factor clusters in 21 regions, 1990-2010: a systematic analysis for the Global Burden of Disease Study 2010. The Lancet 2012; 380, 9859, 2224-2260.
- Flegal KM, Kit BK, Orpana H, Graubard BI. Association of all-cause mortality with overweight and obesity using standard body mass index categories: a systematic review and meta-analysis. Journal of the American Medical Association 2013; 309:71-82. doi: 10.1001/jama.2012.113905
- Campos P. Our absurd fear of fat. The New York Times, 2 January 2013.
- World Health Organization. Obesity: Preventing and Managing the Global Epidemic. Report of a WHO Consultation: WHO Technical Report Series 894. Geneva: WHO, 2000.
- Stommel M, Osier N. Temporal changes in bias of body mass index scores based on self-reported height and weight. International Journal of Obesity (London). 2012 May 1. doi:10.1038/ijo.2012.67.
- Keith SW, Fontaine KR, Pajewski NM, Mehta T, Allison DB. Use of self- reported height and weight biases the body mass index-mortality association. International Journal of Obesity (London) 2011; 35:401-408.
- Bhanji S, Khuwaja AK, Siddiqui F, Azam I, Kazmi K. Underestimation of weight and its associated factors among overweight and obese adults in Pakistan: a cross-sectional study. BMC Public Health 2011; 11:363. doi:10.1186/1471-2458-11-363
- James WPT. Research on Obesity. A Report of the DHSS/MRC Group. London: HMSO, 1976.
- Garrow JS. Treat Obesity Seriously. A Clinical Manual. New York: Churchill Livingstone, 1981.
- James WPT, Ferro Luzzi A, Waterlow JC. Definition of chronic energy deficiency in adults. Report of a working party of the international dietary energy consultative group. European Journal of Clinical Nutrition 1988; 42: 969 981.
- Obesity. A Report of the Royal College of Physicians. Journal of the Royal College of Physicians of London 1983; 17, 1: 3-58.
- Berrington de Gonzalez A, Hartge P, Cerhan JR et al. Body-mass index and mortality among 1.46 million white adults. New England Journal of Medicine 2010;363, 2211-2219. Erratum in: NEJM 2011;365:869.
- Prospective Studies Collaboration. Body-mass index and cause-specific mortality in 900 000 adults: collaborative analyses of 57 prospective studies. The Lancet 2009; 373: 1083–1096.
- Pirie K, Peto R, Reeves GK, Green J, Beral V; for the Million Women Study Collaborators. The 21st century hazards of smoking and benefits of stopping: a prospective study of one million women in the UK. The Lancet 2013;381: 113-141.
- 16 Lawlor DA, Hart CL, Hole DJ, Davey Smith G. Reverse causality and confounding and the associations of overweight and obesity with mortality. Obesity (Silver Spring) 2006 ;14:2294-2304.
- 17 Flegal K. Graubard B, Williamson D, Cooper R. Reverse causation and illness-related weight loss in observational studies of body weight and mortality. American Journal of Epidemiology 2010. doi: 10.1093/aje/kwq341 First published online 8 November 2010.
- 18 Flegal KM, Graubard BI, Williamson DF, Gail MH. Excess deaths associated with underweight, overweight, and obesity. Journal of the American Medical Association 2005; 293: 1861–1867.
Acknowledgement and request
Conflicting or competing interests: I am president of the International Association for the Study of Obesity, and founder of the International Obesity Task Force. Also, I was author or a member of committees responsible for the publications cited as (9), (11) and (12) above. I do not regard these as competing interests.
Readers may make use of the material in this column if acknowledgement is given to the Association. Please cite as: James WPT. Overweight and obesity. Fat matters. [Column]. Website of the World Public Health Nutrition Association, February 2013. Obtainable at www.wphna.org.
All contributions to this website are the responsibility of their authors. They should not be taken to be the view or policy of the World Public Health Nutrition Association (the Association) or of any of its affiliated or associated bodies, unless this is explicitly stated.